SXF FIELD GUIDE / PRODUCTION ENGINEERING · OPERATIONS
AI Agent Observability:
Tracing, Monitoring, Debugging & Incident Response
AI agent observability shows what an agent actually did across model calls, tools, retries, approvals and final outcomes.
Use traces to reconstruct a run, metrics to detect production regressions, and structured events to verify consequences.
Monitor latency, token cost, failures and permissions without copying sensitive prompts into logs.
Connect every alert to a trace, an owner and a safe incident-response playbook.
A complete production field guide to LLM tracing, monitoring AI agent tool calls, token costs, OpenTelemetry instrumentation, debugging workflows and investigating incidents—backed by primary documentation, executable Python and a synthetic monitoring dashboard.
How do you monitor and debug AI agents in production?
Instrument the full execution path with linked agent, model, tool, retrieval and authorization spans. Aggregate verified outcome rates, tail latency, error classes, tokens and costs across all runs. Alert on critical safety failures and sustained anomalies; investigate with redacted traces and confirm the real downstream state. OpenTelemetry supplies interoperability conventions, but your application still owns authorization, evidence collection and incident response.
AGENT OBSERVABILITY · THE CONTROL PLANE
What should you observe in an AI agent?
An agent may return a reassuring answer while leaving a database half-updated, calling a prohibited API or retrying the same expensive request. To debug that gap, you need more than a chatbot transcript. You need three complementary signals: traces to explain a particular run, metrics to detect patterns across many runs, and structured logs/events to capture controlled lifecycle facts. The fourth requirement is independent verification of the actual outcome.
| Signal | What to record | Why it matters |
|---|---|---|
| Execution trace | Run / trace / parent-child span IDs, workflow step, model and version | Reconstruct decision order and dependencies |
| Tool calls | Tool name, allow/deny, start/end, retries, error category, outcome | Identify unauthorized actions, bottlenecks and retry storms |
| LLM operations | Provider, model ID, operation, observed input/output tokens, duration | Explain latency and cost; diagnose model routing |
| Retrieval & memory | Index/version, permission outcome, retrieved document count; avoid raw content | Identify stale evidence and data-access mistakes |
| Final outcome | Independently verified business state, refusal reason or escalated ticket | Separate plausible text from real task success |
| Safety events | Approval ID category, permission decision, policy gate and redacted security event | Find critical failures early without leaking private data |
A trace ID is a correlation key, not proof of correctness. Record a run ID tied to the product's state and use server-side outcome checks for high-impact actions. For conceptual metrics, see AI Agent Reliability; for pre-production tests, see AI Agent Evaluation Checklist. SXF's synthetic marketing agent study shows why run-level outcomes and false alerts matter, while explicitly noting that its operator-pasted responses are not full execution traces. This page is about obtaining evidence continuously in live environments.
LLM TRACING · SEMANTIC CONVENTIONS
Execution traces: spans, context propagation and OpenTelemetry
A distributed trace is a tree of timed operations. Put an agent-run span around the whole attempt, then create child spans for model calls, retrieval, tool execution, authorization and recovery. Preserve parent/child relationships across async tasks, services and message queues using trace context. Use stable, opaque identifiers rather than customer messages as identifiers.
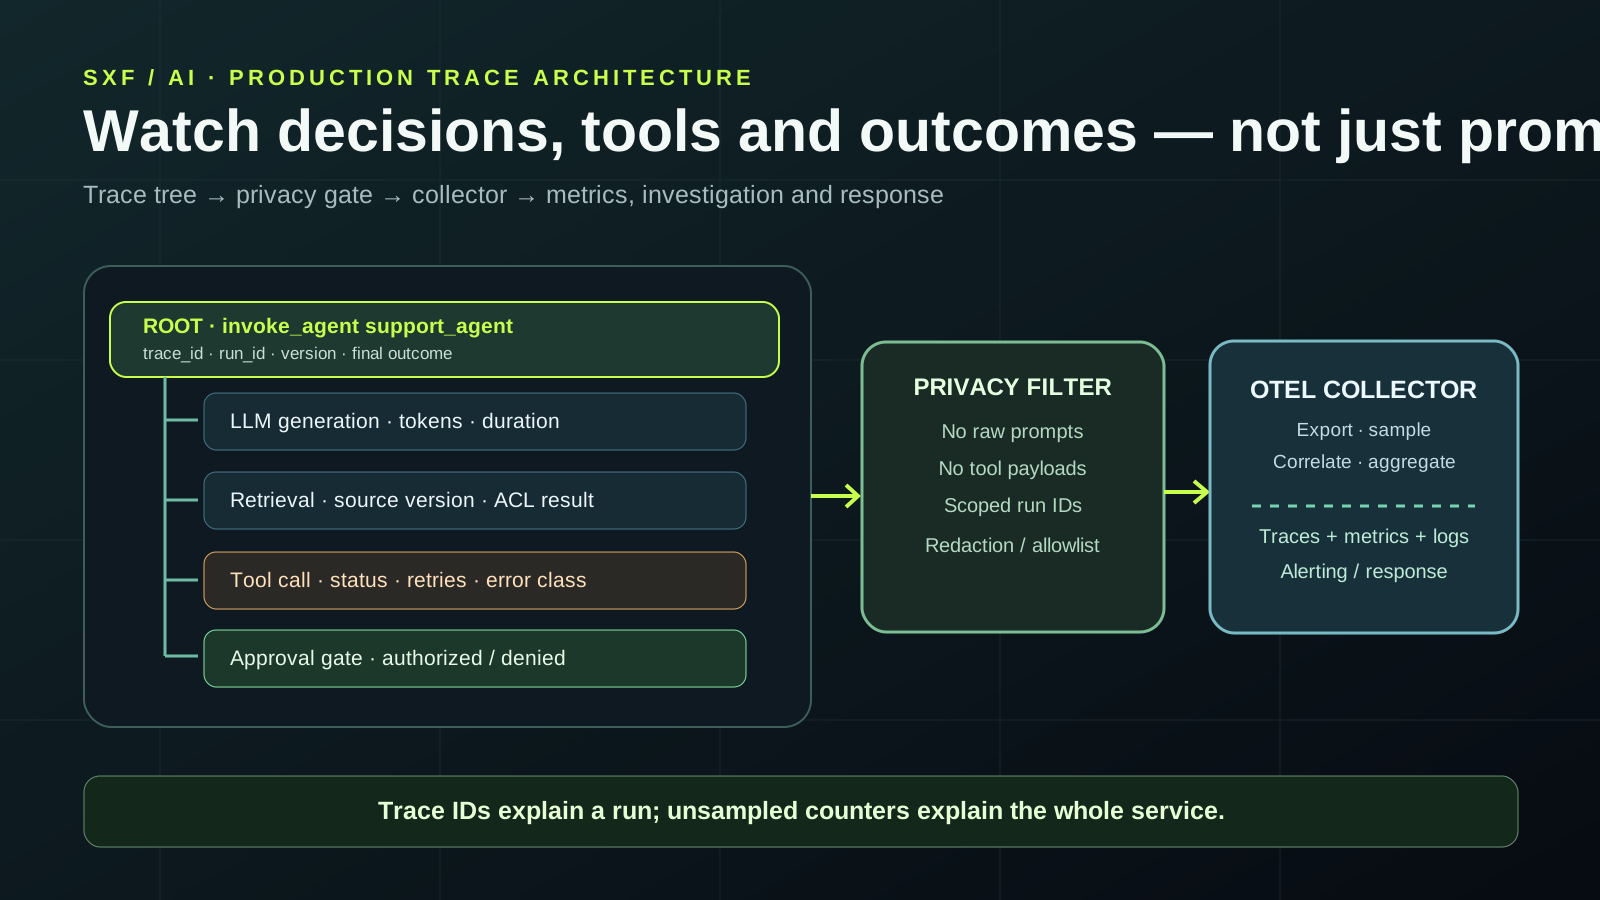
| OpenTelemetry / app attribute | Meaning | Caution |
|---|---|---|
| gen_ai.operation.name | Operation type such as chat, generate_content or agent operation | Use documented values for your SDK/spec version |
| gen_ai.provider.name | Provider identifier | Do not confuse with actual model ID |
| gen_ai.request.model / gen_ai.response.model | Requested and effective model identification where emitted | Capture version and actual provider result |
| gen_ai.usage.input_tokens / output_tokens | Observed token usage where provided | Missing usage is unknown, not zero |
| error.type | Failure category | Prefer bounded, non-sensitive values |
| app.run_id / app.outcome.verified | Your own application-specific correlation and verified result | Custom app fields are not standardized GenAI attributes |
| trace_id / span_id / parent_span_id | W3C trace correlation | Never encode PII in these identifiers |
OpenTelemetry's Generative AI semantic conventions provide common vocabulary across SDKs. Their repository and documents evolve, and some agent semantic conventions remain in Development. Pin the instrumentation version and test the actual exported field names before building dashboards or promises around them. [1–4]
PYTHON IMPLEMENTATION · REAL TRACES
Instrument an AI agent with OpenTelemetry in Python
Start small: create a root span for the run and nested spans around your own tool calls. The following stdlib-compatible example apart from the OpenTelemetry packages uses synthetic, local data. It does not call a live model or payment API. The GenAI operation fields are illustrative where they overlap with spec conventions; application-specific fields are explicitly prefixed app..
# pip install opentelemetry-api opentelemetry-sdk
# Example uses ConsoleSpanExporter; replace it with an approved OTLP
# exporter + collector config once privacy and transport are reviewed.
from opentelemetry import trace
from opentelemetry.sdk.trace import TracerProvider
from opentelemetry.sdk.trace.export import SimpleSpanProcessor, ConsoleSpanExporter
from opentelemetry.trace import Status, StatusCode

provider = TracerProvider()
provider.add_span_processor(SimpleSpanProcessor(ConsoleSpanExporter()))
trace.set_tracer_provider(provider)
tracer = trace.get_tracer("sxf.agent-observability", "1.0")

def authorized_lookup(run_id: str, allowed: bool) -> dict:
    with tracer.start_as_current_span("execute_tool lookup_inventory") as span:
        span.set_attribute("app.run_id", run_id)  # opaque, non-PII ID
        span.set_attribute("app.tool.name", "lookup_inventory")
        span.set_attribute("app.authorization.allowed", allowed)
        if not allowed:
            span.set_attribute("app.tool.outcome", "denied")
            return {"status": "denied"}
        span.set_attribute("app.tool.outcome", "ok")
        return {"status": "ok", "count": 3}  # synthetic response

def execute_agent(run_id: str) -> dict:
    with tracer.start_as_current_span("invoke_agent support_agent") as root:
        root.set_attribute("app.run_id", run_id)
        root.set_attribute("app.agent.name", "support_agent")
        with tracer.start_as_current_span("chat plan") as model_span:
            # Only set actual provider-reported usage, not made-up tokens.
            model_span.set_attribute("gen_ai.operation.name", "chat")
            model_span.set_attribute("gen_ai.provider.name", "example_provider")
        result = authorized_lookup(run_id, allowed=True)
        root.set_attribute("app.outcome.verified", result["status"] == "ok")
        return result

if __name__ == "__main__":
    execute_agent("demo-run-001")
# Do not export prompts, customer text, secret tokens or raw tool payloads.
The console exporter is for local demonstrations; production systems should use an approved SDK processor and a secure OpenTelemetry Collector with suitable authentication, sampling, storage and retention. Automatic instrumentation is convenient, but inspect precisely which attributes it exports before enabling it in a customer environment. [4–8]
INTERACTIVE DEMO · SYNTHETIC TELEMETRY
AI agent monitoring dashboard: traces, errors, latency and costs
Explore a synthetic production-style dataset. Change the scenario to see how success rate, p95 latency, token use, tool errors and cost can tell different stories. This is a browser-only demonstration using authored sample records; it does not connect to your site's telemetry or any provider.
Example run telemetry · not live metrics
Each scenario highlights a different diagnostic pattern.
Synthetic records with manually specified timing, counts and costs. No user data is stored or sent by this widget. These values must not be cited as independent operational evidence.
CASE STUDY · END-TO-END INCIDENT RESPONSE
Production incident: an agent retried a failing tool until cost and latency spiked
Scenario (fictional): at 14:03 UTC, a customer-support agent receives an inventory question. Its inventory tool times out repeatedly. The agent retries three times without a strict retry budget, prompts the LLM to re-plan, and approaches an unauthorized write path. A server-side approval gate blocks the write. The answer arrives late; although the final text appears calm, operationally the workflow did not complete normally.
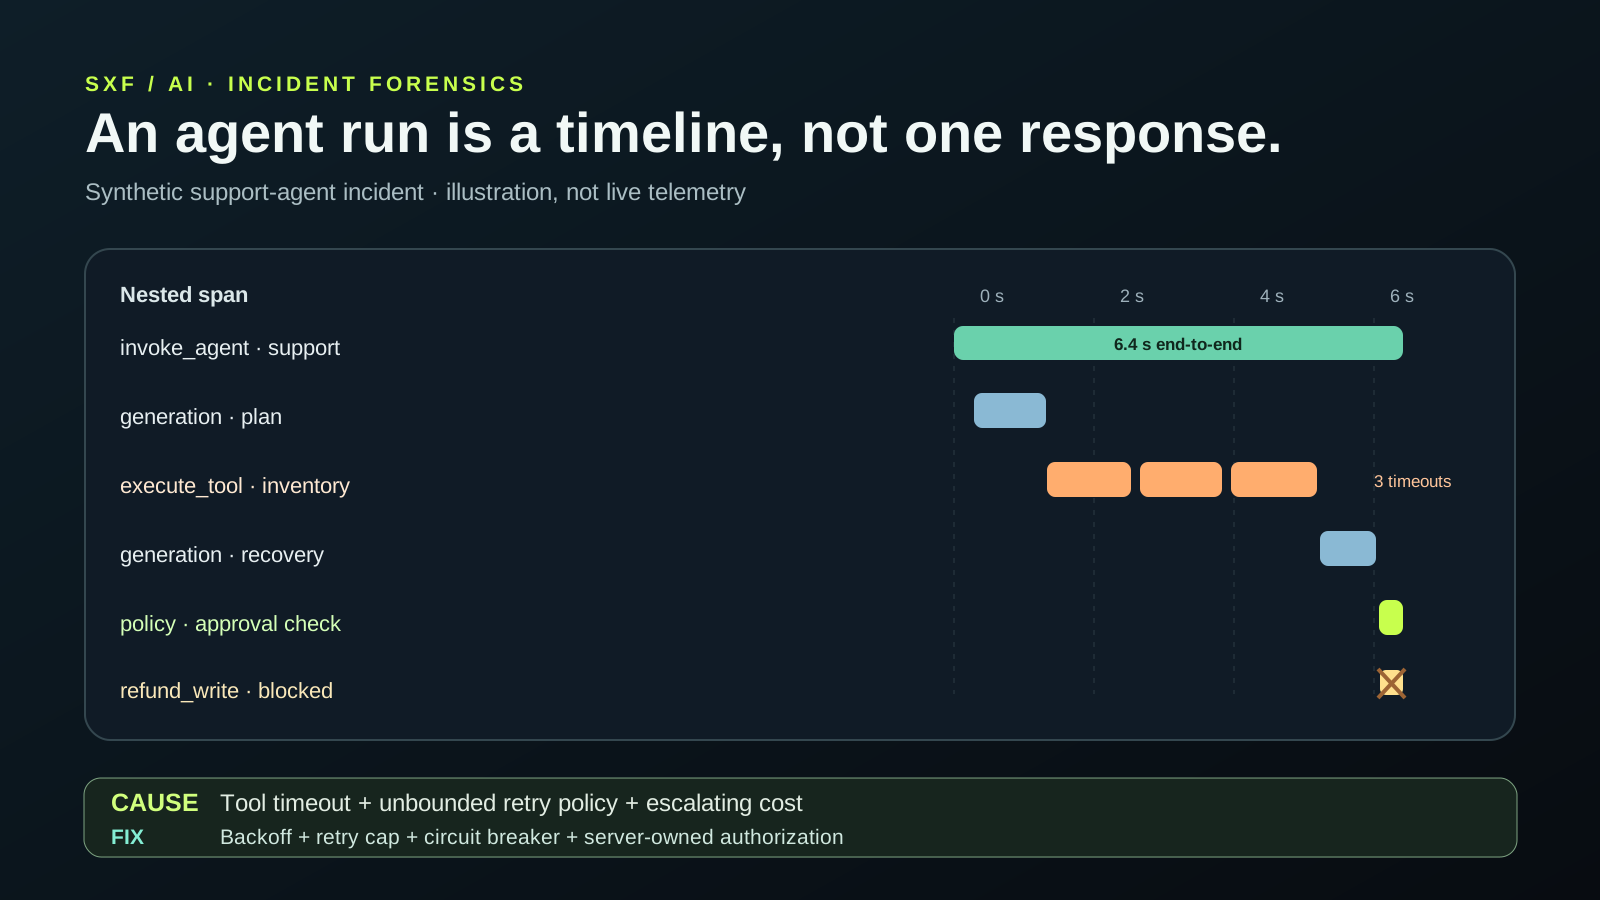
| Stage | Evidence | What the team learns |
|---|---|---|
| Detection | Sustained p95 latency rise, timeout counter and elevated cost/run | This is not only a model-response issue |
| Triage | Trace correlation shows tool-call children on same run ID | The external inventory API is a likely trigger |
| Containment | Disable writes, cap retries, fail closed and escalate requests | Prevent unauthorized or duplicate side effects |
| Root-cause test | Replay with simulated API timeout and current retry policy | Verify which control allowed repeated calls |
| Remediation | Exponential backoff + jitter, circuit breaker, deadlines and idempotency keys | Keep failures bounded even when the tool stays down |
| Verification | Re-run acceptance and failure tests; monitor p95, cost, completion and denied actions | Do not close incident after improving only average latency |
| Postmortem | Document timeline, blast radius, customer impact and missing alerts | Convert the incident into regression tests and runbook changes |
The key diagnosis is not simply “the model hallucinated.” The agent architecture allowed a failing dependency to create repeated orchestration work. Reliability comes from explicit timeout budgets, independent side-effect verification and safe human escalation. Read AI Agent Security for permission boundaries and AI Agent Authorization for policy gates.
OPERATIONAL METRICS · ACTIONABLE ALERTS
Which SLIs, SLOs and alerts matter for AI agents?
Define service-level indicators from verifiable events, not prose sentiment. Set objective thresholds from your own baseline, traffic, criticality and error budget. Illustrative targets below are planning examples, not universal industry SLOs. The most dangerous failure can be rare: authorization bypass should page immediately, while modest cost variance may warrant investigation rather than a 3 AM alarm.
| SLI | Suggested measurement | Alert strategy |
|---|---|---|
| Verified completion rate | Accepted tasks ÷ attempts with confirmed final state | Sustained rolling regression; stratify by tool/dependency |
| p95 run latency | Run end − start across all observed requests | Burn-rate or sustained percentile alert |
| Tool failure / timeout rate | Failed tool attempts ÷ tool attempts | Alert by tool and retry amplification |
| Unauthorized side effects | Verified writes with no scoped approval | Immediate critical event, zero-tolerance gate |
| Missing telemetry | Requests without essential run outcome and trace correlation | Instrumentation health alert |
| Cost per accepted task | Total attributed spend ÷ independently verified accepted tasks | Budget anomaly by model, environment and cohort |
| Token-use anomalies | Input/output totals with provider/model tags | Detect routing loops or massive prompts |
Sampling matters: sampled traces help investigate, but sampled runs cannot serve as the denominator for complete service rates without correction. Use unsampled or appropriately aggregated counters for requests, errors, costs and verified outcomes; keep representative traces for root-cause analysis and a controlled retention policy for error traces. Be careful that tail sampling may require collector resources and may see incomplete traces in distributed deployments. [5, 7]
TOKEN USAGE · BUDGET ENFORCEMENT
Monitor token usage and enforce AI agent cost limits
Token accounting must be model- and provider-aware: input tokens, output tokens, cached-input discounts, tool costs, retries, premium modes, requests rejected upstream, and billing-period differences affect the real total. A trace can show where tokens were spent, while aggregate metrics show whether an agent is consuming its error budget or financial budget.
(input charges + output charges + tool fees + infrastructure + review and retry costs) / independently accepted tasksIf any input is missing, label the estimate as partial rather than replacing absent usage with zero. Track two separate numbers: a real accounting/billing total and the lower-latency estimated spend derived from observed usage.
Enforce a hard application-side maximum on model calls, total tokens, tool invocations and elapsed time per run. An LLM instruction such as “spend less than $1” is not a budget enforcement mechanism. See AI Agent Cost & TCO and Model Pricing for cost modeling.
PRIVACY · SECURITY · SAFE TRACING
How to avoid leaking sensitive data into AI agent logs
Full prompts, tool responses, stack traces and retrieved documents can contain personal data, secrets, access tokens and privileged business records. The most durable principle is data minimization at source: emit safe IDs, numeric measurements, bounded enum labels and separately authorized summaries instead of raw content. Masking at a backend is a useful second line, but it cannot guarantee removal from copies that left your process earlier.
| Control | Implementation | Failure it prevents |
|---|---|---|
| Attribute allowlist | Export only pre-approved span keys and bounded values | Accidental prompt/PII capture |
| Run-scoped opaque IDs | Use random identifiers; avoid emails and user text | Linkability and sensitive identifiers |
| Collector filtering | Drop high-risk attributes; secure credentials and transport | Uncontrolled propagation to analytics tools |
| Tenant partitioning | Access checks in both source systems and telemetry UI | Cross-tenant observability data leaks |
| Retention and deletion | Limit trace lifetime, protect backups, document deletion path | Long-lived sensitive incident archives |
| Sampling policy | Capture exceptions safely without forcing full payload collection | Accidental high-volume secret capture |
| Tool authorization | Log allow/deny outcome, not the secret or payload itself | Privileged data exposure |
Self-hosting does not automatically make traces private if operators and integrations can read them. Review SDK defaults, the collector configuration, your hosted vendor's retention and access policies, and any tracing enabled by frameworks. OpenAI's Agents SDK, for example, has built-in tracing features with configurable sensitivity behavior: confirm them for the exact SDK version and your data controls. [8, 9]
AGENT OBSERVABILITY TOOLS · COMPARISON
OpenTelemetry vs LangSmith vs Langfuse vs Phoenix: which tool fits?
These products are not identical substitutes. OpenTelemetry defines instrumentation and interoperability plumbing rather than a complete agent debugging UI. Other tools add trace inspection, prompt evaluation, datasets, sessions or workflow views. This is a capability and deployment comparison, not an invented benchmark or price ranking.
| Tool / layer | Good fit | Key evaluation question |
|---|---|---|
| OpenTelemetry + Collector | Vendor-neutral trace, metric and log instrumentation | Can your collector export a minimized, versioned schema? |
| LangSmith | LangChain/LangGraph app debugging and evaluation | How are runs linked to feedback and datasets? |
| Langfuse | LLM traces, prompts, generations and production analytics | Does deployment/retention meet your needs? |
| Arize Phoenix | Open-source inspection, experimentation and trace analysis | Does it work with your OTLP/trace pipeline? |
| Native agent SDK tracing | Fast framework-level instrumentation and workflow spans | What is collected by default, and where is it stored? |
Shortlist based on your framework, whether you must self-host, on-call workflow, dashboards, alert integrations, token/cost attribution, RBAC and retention rules. Link telemetry to your existing incident system; a good trace viewer without paging and remediation practice is insufficient for production.
PRODUCTION RELEASE CHECKLIST
AI agent observability checklist: deploy, detect, diagnose and learn
The checklist is interactive only in your browser; checking a box does not certify your deployment. Use the 25-test evaluation scorecard alongside live monitoring, rather than treating either as a replacement for the other.
SEARCH QUESTIONS · DIRECT ANSWERS
Frequently asked questions about AI agent observability
What is AI agent observability?
AI agent observability is the ability to reconstruct a run across model calls, tools, state changes, approvals and final verified outcomes using correlated traces, metrics and safe structured logs. It supports debugging, alerts, cost control and incident response.
How do I monitor AI agents in production?
Instrument run-level and child spans, count outcomes and errors outside sampling, track token costs, tool failures, latency percentiles and authorization decisions, then alert on sustained deviations with trace-linked investigations.
What is the difference between LLM tracing and agent monitoring?
LLM tracing captures model operations and their metadata. Agent monitoring joins model spans to tools, branching, memory access, approvals, retries and verified side effects, then aggregates data across runs.
Which AI agent observability tool is best?
The best choice depends on OpenTelemetry compatibility, hosted versus self-hosted retention, SDK support, pricing, redaction controls, deployment requirements and the ability to correlate traces with outcomes. Run a pilot before choosing.
Does OpenTelemetry support AI agents?
OpenTelemetry publishes Generative AI semantic conventions, including agent and tool spans; some conventions remain under development. Record the spec/library versions and confirm emitted attributes rather than assuming one permanent standard.
Should I log full prompts and tool responses?
Usually not by default. Prefer safe identifiers, allowed numeric attributes, error classes and explicitly approved summaries. Protect sensitive content through collection-side minimization and server-side controls before export.
How do I monitor token usage and cost?
Collect input/output token counts where providers supply them, preserve model and pricing version, distinguish missing counts from zeros, and calculate attributed estimates with cache and tool charges. Compare cost per verified accepted task.
Which alerts matter most for agents?
Unauthorized actions, permission bypass, data exposure, sustained outcome failures, tool timeout/retry storms, tail latency regression, unexpected spend, and missing telemetry deserve attention. Require runbooks and escalation owners.
Can traces prove an agent completed a task?
No. Traces show what instrumentation recorded, not necessarily the external system’s true state. Verify downstream records or independent acceptance checks for consequential outcomes.
What is the difference between testing and observability?
Evaluation checks behavior against a designed test suite; observability captures signals from live runs. Use production incidents to add regression cases, and use evaluation releases to define monitoring thresholds.
OFFICIAL SOURCES · EDITORIAL METHOD
Primary research and source ledger
Reviewed October 17, 2026. This reference uses OpenTelemetry documentation for the conceptual telemetry model and current GenAI semantic-convention names, plus official vendor documentation for tool capabilities. Schema stability and version compatibility must be rechecked before instrumenting production. The incident scenario, diagram, dashboard numbers and demo cost values are authored synthetic examples; SXF has not claimed access to any customer's private telemetry or completed a live production benchmark. Vendor pricing and feature tiers are intentionally not guessed.