SXF / AI RESEARCH BRIEF · ENTERPRISE UNIT ECONOMICS · 2026
AI Agent Cost in 2026: Enterprise TCO, Reliability & ROI Analysis
How much does an AI agent really cost a business? We model three enterprise workflows from source-linked API prices through human review, reliability, implementation, governance and accepted outcomes. We also report an original, reproducible empirical experiment on 24 synthetic support-policy cases with a locally run model. The cost scenarios remain modeled; the model accuracy and latency were actually measured.
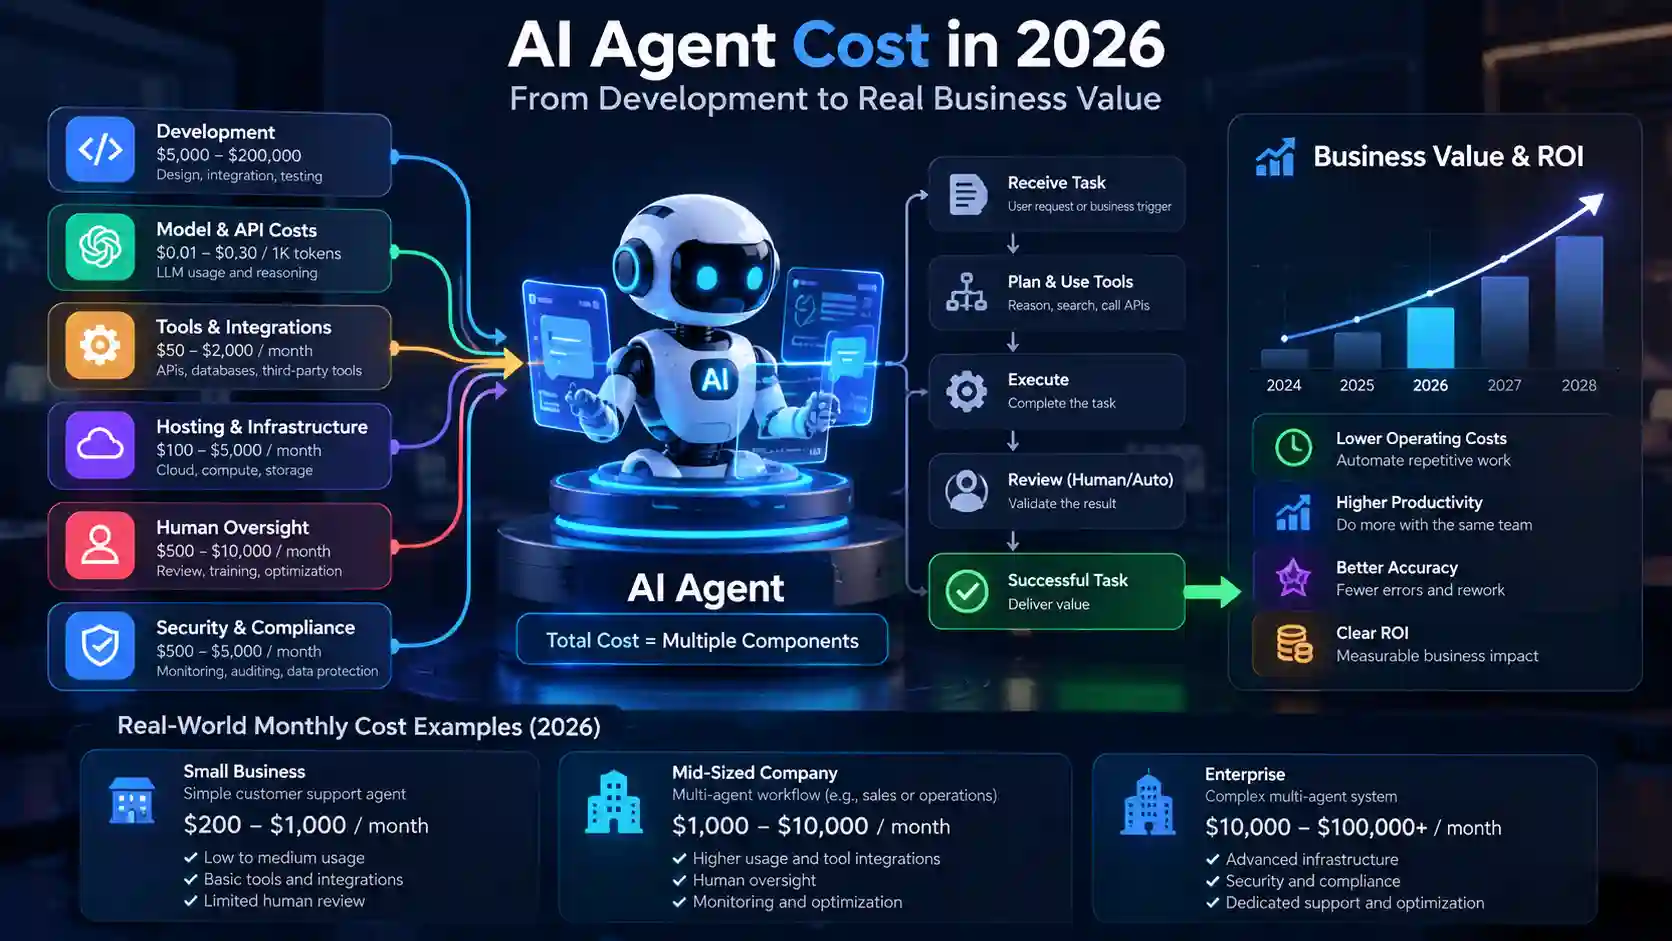
AI agent cost has no universal monthly price. The meaningful unit is an accepted business outcome.
A model may charge cents for thousands of tokens yet require approvals, monitoring, connectors, engineering and a fallback human team. Comparing only the model API bill therefore understates enterprise total cost of ownership (TCO). The investor-grade question is not “How cheap are the tokens?” but “How much does it cost to deliver one accepted outcome, at the quality and risk level our business requires?”
In our illustrative twelve-month scenarios, a support triage workflow produces a positive modeled case, invoice extraction comes close to break-even, and research synthesis remains uneconomic under its assumptions. These outcomes are deliberately mixed. Real deployments can be better or worse; a pilot must establish acceptance rates, baseline time and value realization before a business case is approved.
Cost per accepted task
$1.2482% assumed acceptance · +82.9% modeled ROI. Favorable only if freed work yields 65% of modeled realizable labor value.
Cost per accepted document
$6.3490% assumed acceptance · −2.8% modeled ROI. Better model accuracy alone may not overcome integration and review expense.
Cost per accepted brief
$34.8172% assumed acceptance · −37.8% modeled ROI. Oversight and specialist labor remain dominant.
These are not observed benchmark results. The figures use three explicit example workloads and model pricing records from the SXF catalog. Inspect the complete machine-readable assumptions (JSON) or use the AI Agent Cost Index to enter your own workload and live catalog choices.
Agent economics turn on task definition, reviewer time, realizable benefits and failure recovery. Nominally cheaper tokens do not guarantee cheaper accepted work. An organization should insist on an independently graded, repeatable evaluation dataset before it treats any modeled ROI as a finance forecast.
A falsifiable enterprise cost model, with assumptions exposed.
We define a task as a complete business request; an agent call as one billable model invocation; an accepted result as an output that passes workflow-specific quality, security and policy criteria. These units are not interchangeable. A task can contain several calls, be retried, require human review, and still fail acceptance.
Research question and competing hypotheses
H1 — viable automation: captured value from accepted outcomes can exceed incremental agent spend over twelve months. H2 — oversight drag: increased review, rework and governance can dominate model prices. H3 — scale threshold: fixed implementation and platform costs mean unit economics improve only if useful throughput is sustained. We cannot claim these hypotheses were empirically confirmed here; the scenarios demonstrate how to test them.
Evidence tiers: measured, sourced, assumed and excluded
| Input or claim | Evidence class | What it means |
|---|---|---|
| Standard API input and output rates | Source-documented, catalog-maintained | Stored from model provider pages; subject to dated terms and subsequent changes. |
| Calls, retry share, reviewer hours, labor rate, success | Illustrative assumption | Provided in the openly readable scenario dataset; not statistically estimated. |
| Monthly cost, year-one TCO, cost per accepted task, modeled ROI | Calculated result | Deterministic outputs from the stated inputs; not deployment outcomes. |
| Real-world agent reliability, recovered staff capacity, security incidents | Not measured in this study | Requires controlled testing and operational telemetry before business approval. |
What we calculate, step by step
          Modeled calls = monthly tasks × calls per task × (1 + retry overhead)

          API cost = calls × (input tokens × input rate + output tokens × output rate) ÷ 1,000,000

          Reviewer cost = tasks × review share × minutes per review ÷ 60 × loaded hourly rate

          Recurring cost = API + tools + review + infrastructure + operations + maintenance + security + platform

          Year-one TCO = 12 × recurring cost + one-time implementation

          Accepted tasks = attempted tasks × accepted success rate

          Cost / accepted task = year-one TCO ÷ (12 × accepted monthly tasks)

          Captured monthly value = accepted tasks × baseline manual minutes ÷ 60 × baseline loaded hourly rate × realization factor

          Year-one ROI = (12 × captured monthly value − year-one TCO) ÷ year-one TCO
Important accounting distinction: “Captured value” is a conservative modeling assumption representing the portion of avoided manual work that actually releases capacity or expense. Time theoretically saved is not automatically payroll cash saved. Human review cost is an added agent-system expense, while the rejected or unautomated work remains with the baseline team; we do not count its baseline cost twice as savings.
All three cases use a specific published Standard API token price from the SXF catalog, snapshot verified at the per-model date, alongside a study as-of date of October 10, 2026. If provider pricing changes, the historical table remains a dated scenario snapshot; the interactive section loads the maintained model catalog instead of inventing future rates. The model is restricted to uncached text input and output pricing; cache writes, storage, large-context uplifts, grounding, media, batch tiers, service-level commitments, currencies other than USD and taxes are not modeled unless budgeted separately.
The full AI agent cost stack: beyond inference.
Consumer-facing examples often mention “cost per million tokens.” Enterprise procurement must consider the complete chain from secure intake to accepted action, audit and incident recovery. The following nine layers should be itemized separately rather than rolled into a single unexplained per-task estimate.

| Layer | What to include | Typical undercount |
|---|---|---|
| 1. Model inference | Uncached and cached tokens, long context, output, retries, reasoning and service tiers | Using one prompt cost as the cost of a whole workflow |
| 2. Tools and external APIs | Search, CRM, email, code execution, retrieval, OCR and data enrichment | Ignoring paid actions and third-party call limits |
| 3. Infrastructure and orchestration | Queues, runtimes, databases, network transfer, context storage, memory and logging | Assuming a hosted model API includes workflow hosting |
| 4. Human oversight | Review, correction, escalation and quality assurance | Counting “automated” attempts that still consume staff time |
| 5. Implementation and integration | Data mapping, identity, SSO, connectors, evaluation harness and migration | Spreading setup expense across too few months or excluding it |
| 6. Ongoing engineering | Monitoring, prompt/tool updates, incident response and version regression tests | Budgeting a successful pilot but not a changing production system |
| 7. Security and governance | Least privilege, human approvals, audit logs, retention, red-teaming and access review | Pricing compliance work at zero |
| 8. Reliability and rework | Retries, duplicate operations, wrong actions, SLA breaches and recovery effort | Excluding failed attempts from the denominator or cost |
| 9. Commercial and exit costs | Licenses, seats, minimum commitments, data export, portability and vendor transition | Optimizing month-one fees while ignoring switching expenses |
Two separate prices may be correct simultaneously: a provider's direct API price and an intermediary's resale price. The relevant baseline for enterprise TCO is the actual billing channel used in the architecture. Review primary vendor terms, context-dependent tiers, geography and contract exclusions before approving a quote.
What does an AI agent cost per month in three realistic workflow shapes?
The scenarios vary task volume, model workload, human checks, retry overhead and operational support. They are plausible planning exercises, not measured market averages. Each keeps enough detail to recalculate the figures without relying on an opaque calculator.
| Economic measure | Support triage | Invoice processing | Research briefs |
|---|---|---|---|
| Model used for scenario | GPT-6 Luna | Claude Sonnet 5 | GPT-6 Sol |
| Tasks / month | 10,000 | 2,400 | 800 |
| Calls / task, before extra retry calls | 3 | 4 | 7 |
| Extra retry calls | 12% | 18% | 25% |
| Human-reviewed attempts | 20% | 38% | 70% |
| Assumed accepted-task rate | 82% | 90% | 72% |
| Model API / month | $16.80 | $271.87 | $280.00 |
| Tool charges / month | $134.40 | $158.59 | $280.00 |
| Human review / month | $4,900.00 | $5,289.60 | $8,493.33 |
| All-in recurring monthly cost | $8,701.20 | $10,190.06 | $15,053.33 |
| One-time implementation | $18,000 | $42,000 | $60,000 |
| Year-one TCO | $122,414.40 | $164,280.77 | $240,640.00 |
| Cost / accepted outcome, with setup allocated | $1.24 | $6.34 | $34.81 |
| Year-one modeled ROI | +82.9% | −2.8% | −37.8% |
Rounding is applied only for display. The calculation uses unrounded underlying costs and is reproducible in the assumptions JSON and the scenario interaction below. This is not a model ranking: different tasks, input lengths and acceptance criteria mean the three models are not interchangeable.
Case A — customer support triage: the apparent winner still depends on value realization
Scenario: 10,000 tickets per month, three model calls each, a 12% additional call overhead and an assumed 82% accepted result rate. Reviewer time is 3.5 minutes for 20% of attempted tasks. The selected model API charge is just $16.80/month, but human review is $4,900/month and the complete recurring cost is $8,701.20/month.
With an illustrative baseline of five human minutes per accepted ticket at $42 loaded hourly cost, and only 65% of theoretical time value realized, modeled captured monthly value is $18,655. The modeled year-one ROI is positive after $18,000 setup. This does not mean that 82% of real tickets will be safely solved or that an employer can remove $18,655 from payroll. Those require field measurement.
Case B — invoice processing: stronger assumed accuracy is not enough
Scenario: 2,400 documents each month, four calls per document, 18% extra calls, a 90% accepted-document assumption and 38% human review. The model API bill is about $272/month. The full recurring cost is around $10,190/month after reviewer labor, maintenance, controls and platforms. With $42,000 initial integration and only 55% modeled value realization, year-one ROI is −2.8%.
Why this matters: invoice matching is not just text extraction. Field accuracy, duplicate detection, vendor validation and financial controls determine the value of the result. A superficial demo could look excellent while the first twelve months fail the investment hurdle.
Case C — research synthesis: expert verification can absorb the apparent savings
Scenario: 800 briefs monthly, seven calls per brief, 25% additional calls and 70% expert review. The API charge is modeled at $280/month, but reviewer cost rises to about $8,493/month. With a conservative 72% accepted-brief assumption and a 50% labor-value realization factor, the modeled year-one ROI is −37.8%.
The right recommendation may be defer, reduce scope to source collection, or demand a smaller, more verifiable research product. The conclusion is not that research agents cannot work: it is that this specific modeled economic configuration fails the stated investment test.
How failure changes cost: distinguish task success, tool success and business acceptance.
Agent reliability is not a single “accuracy” score. For procurement, the essential distinction is between attempted tasks and business-accepted outcomes. A model can produce fluent text, call a tool successfully and still return an unapproved refund, miss an invoice field, misquote a source, exceed a response deadline or violate access policy.
Five metrics procurement should ask vendors to report
1. Accepted task completion rate
Numerator: independently graded, policy-compliant tasks accepted by the business owner. Denominator: all assigned tasks, including timeouts, refusals, abandoned runs and recovered failures. Report abstentions separately, not as wins.
2. Human correction minutes and escalation incidence
How often a person must approve, rewrite, repair or intervene, how long it takes, and whether the human remains accountable for execution.
3. Retry cost, duplicate-action rate and tool correctness
Report tool-call accuracy, redundant calls, side-effect idempotency and downstream reversals. Retries that reissue a payment or customer message have a cost beyond tokens.
4. P50/P95 completion time and breach cost
Include queueing, search and approval latency. A cheap answer delivered after a contractual SLA may have negative enterprise value.
5. Incident rate and bounded loss exposure
Track unauthorized actions, sensitive-data exposure, prompt injection, audit completeness and recovery procedures. Low average cost cannot compensate for unbounded catastrophic tail risk.
Anthropic describes evaluation practices combining task-specific grading, multi-turn test cases and repeated regressions. Microsoft Foundry likewise distinguishes end-to-end task completion from process metrics such as tool selection and parameter accuracy. These are methodological references, not independent proof of the success rates assumed in our scenarios. See Anthropic's evaluation methodology and Microsoft's agent evaluators.
Stress-test the enterprise decision: acceptance, review and realized value.
Unlike the general-purpose AI Agent Cost Index calculator, this interactive model keeps three researched scenario definitions fixed and isolates the economics of reliability and human oversight. It reads our documented assumptions and the existing SXF catalog; it does not invent current vendor pricing or report your inputs to a server.
Modeled break-even accepted rate: —. Adjust parameters to examine how the result changes.
Need a different volume, provider or workflow? Use the full AI Agent Cost Index →
What happens when the assumptions move? A 375-run deterministic stress test.
We enumerated 125 parameter combinations for each of the three existing workflows (375 in total). Accepted success, human-review share, and realized value independently shift by −10, −5, 0, +5, or +10 percentage points from their declared baselines, clipped to the 0–100% range. We separately recomputed half and double monthly task volume while retaining setup and fixed operating costs. Every result uses the same published study equations and dated model-price records.
| Workflow | Base ROI | 125-case ROI range | Grid cases at or above 0% ROI | Half / double workload ROI |
|---|---|---|---|---|
| Customer support triage | +82.9% | +9.6% to +211.6% | 125 / 125 | +21.5% / +144.6% |
| Invoice and document processing | -2.8% | -35.8% to +42.1% | 53 / 125 | -38.6% / +37.1% |
| Research and evidence synthesis | -37.8% | -59.6% to -9.5% | 0 / 125 | -59.8% / -14.2% |
Interpretation: support triage remains positive across this specified grid; invoice economics cross zero; research remains negative. The 53/125 or 125/125 figures are not probabilities: parameter combinations were enumerated, not sampled from a measured distribution. The range is not a statistical confidence interval or evidence of actual deployment performance.
Reproduce and audit: Download all summary results and experiment protocol (JSON), review the calculation generator, and run node scripts/agent_economics_stress_test.cjs --check against the repository. The experiment is intentionally limited to three hypothetical workflows; it does not run real agents, measure quality, sample customer tasks, estimate probability, or establish representative industry ROI.
TCO and ROI are different questions. Payback is a third.
Total cost of ownership asks what the organization must spend to launch and operate the complete agent system. ROI asks whether captured incremental value exceeds that spend. Payback asks when incremental recurring value covers one-time setup. Each needs a common time horizon, a defensible baseline and the same boundary for what counts as incremental agent expenditure.
Support triage: work through the economics
| Equation | Support scenario |
|---|---|
| Monthly recurring = API + tools + review + infrastructure + operations + maintenance + security + platform | $8,701.20 |
| Year-one TCO = 12 × $8,701.20 + $18,000 implementation | $122,414.40 |
| Accepted tasks / month = 10,000 × 82% | 8,200 |
| Captured monthly value = 8,200 × 5 minutes ÷ 60 × $42 × 65% | $18,655.00 |
| Year-one net modeled value = 12 × $18,655 − $122,414.40 | +$101,445.60 |
| Year-one modeled ROI = $101,445.60 ÷ $122,414.40 | +82.9% |
| Simple implementation payback = $18,000 ÷ ($18,655 − $8,701.20) | 1.8 months |
This is an illustrative payback calculation, not a prediction. If production ramps slowly, procurement fees are prepaid, accounting recognizes only hard savings, or deployment requires parallel staff, actual cash payback shifts later—or disappears. Avoid comparing “hours saved” with contract payments without a conversion policy approved by Finance.
Stress-test the assumptions before presenting ROI to a CFO
Ask whether demand stays constant; whether the manual baseline includes quality control; whether new work appears because automation becomes cheaper; whether SLA penalties differ; whether workload seasonality creates unused platform commitments; whether labor can truly be redeployed; and whether accepted outcome rates hold under new data, languages and adversarial inputs. Calculate best case, base case and downside case. Never quote only the best case.
Ongoing value versus budgeted cash savings
Economic value can take different forms: an eliminated external processing invoice, a measurable avoidance of overtime, incremental contribution margin, or extra capacity without hiring. All are potentially meaningful but cannot be treated as equivalent evidence. State which one you are measuring. If an organization simply redirects analysts to higher-value work, label that as capacity value rather than an immediate reduction in payroll expense.
Build, buy or defer? Use economics and controllability—not fashion.
Build
Consider when the workflow is strategically differentiating, deep system integration is unavoidable, data residency/permissions are critical, task volume is sufficiently large, and the engineering team can maintain evaluation and controls. Include the opportunity cost of ownership.
Buy
Consider standardized workflows with mature connectors, auditable SLAs and clear vendor liability, where shorter delivery time outweighs control trade-offs. Price seats, tasks, overages, audit exports and exit costs, not just the headline subscription.
Defer
Consider when business acceptance is not measurable, safe tools or data permissions cannot be granted, operational risk is unbounded, integration cost outweighs plausible value, or a deterministic non-agent workflow performs better.
Build-versus-buy twelve-month comparison worksheet
| Budget line | Internal build | Third-party platform |
|---|---|---|
| Upfront | Architecture, integration, evaluation, security review, training | Implementation, connectors, data onboarding, procurement |
| Variable recurring | Model calls, tools, storage, queues, cloud resources | Task consumption, seat or credit overage, external APIs |
| Fixed recurring | Engineering ownership, observability, compliance, incident response | Licenses, support tier, minimum commit, internal vendor supervision |
| Reliability burden | Build and maintain independent task graders and rollback paths | Verify contractual acceptance criteria and independent evaluations |
| Exit cost | Replacement architecture, team retraining, proprietary components | Migration, export, lock-in, API changes, dual running |
| Decision test | Normalize both options on the same 12-month horizon, accepted-task denominator, service levels, control obligations and discounted cash flows where appropriate. | |
A vendor may reduce deployment friction but increase switching costs; an internal build may improve control but consume substantial engineering capacity. There is no universally cheaper direction. A financial model that excludes supervision on the vendor path or engineering time on the build path is biased by construction.
SXF / AI original empirical study: 83.3% accuracy in real Qwen model tests.
This is a real, reproducible experiment using actual AI-model responses, not merely estimated performance. The test cases are synthetic; no company, customer or production system was involved, and it is not a deployed autonomous agent study. We evaluated the openly licensed Qwen3-4B-Instruct-2507 model (4-bit GGUF, CPU llama.cpp) against 24 pre-registered, author-written support policy scenarios. Each scenario was repeated three times per GitHub Actions workflow, in two separately executed workflows. Both workflows returned 60 correct structured decisions out of 72 attempts (83.3%); each 24-case repetition scored 20/24. The runs used the same scenarios and are not 144 independent real-world samples.
| Observed measurement | Workflow run #1 | Workflow run #2 |
|---|---|---|
| Cases × repeated decisions | 24 × 3 = 72 | 24 × 3 = 72 |
| Correct structured decisions | 60 / 72 (83.3%) | 60 / 72 (83.3%) |
| Invalid replies / API failures | 0 | 0 |
| Median measured response latency | 3.865 s | 7.966 s |
| P95 measured response latency | 5.036 s | 10.288 s |
| Provider inference API fees | $0 (local CPU inference) | $0 (local CPU inference) |
Four repeatable failure cases: SX-009 suggested replacement beyond the documented damage window even while its explanation identified the correct escalation; SX-014 labeled an eligible cancellation as a refund; SX-017 denied an eligible unshipped cancellation; SX-023 used a refund-denial label for a warranty denial. Each of the four failed in all three repetitions of both workflow runs. These cases illustrate why explanations alone are not a substitute for correctly typed, reviewable decisions.
Evidence and audit trail: machine-readable results summary, synthetic test cases and decision rubric, full run #1 (download raw response artifact), and full run #2 (download raw response artifact). Both workflow jobs completed successfully. Data, model checksum, runner code, seeds, and llama.cpp engine revision are recorded for replication.
Cost boundary: the $0 above means no provider inference API fee. It does not include CPU compute value, electricity, engineering time, manual review, infrastructure, or deployment. These figures do not establish cost per accepted enterprise ticket, total cost of ownership, enterprise ROI or production safety; the three economic scenarios elsewhere on this page remain explicitly modeled.
How to turn this scenario analysis into evidence a company can trust.
A serious evaluation begins by defining what “correct” means for each task before looking at the agent's output. For support, the accepted unit may be a ticket with correct categorization and policy-compliant next action. For invoices, it may be a document with validated key fields and human-approved posting. For research, it may be a brief with grounded citations and a factual review pass.
- Choose a narrow workflow and safety boundary. Specify allowed actions, excluded decisions, data access and when a human must approve.
- Collect a representative task set. Include common cases, long-tail exceptions, multilingual data, ambiguous requests and known failure patterns. Obtain permission for every dataset.
- Define a baseline. Measure current manual time and quality on the same task population, including escalation and correction cost.
- Pre-register acceptance rubrics. Use independent graders or trained human reviewers; include double review and adjudication for subjective decisions.
- Run repeated trials. Hold task mix and external state constant where possible. Log model version, prompts, tools, environment, tokens, cost, time and all failures.
- Test adversarial and operational paths. Probe prompt injection, tool privilege boundaries, duplicated actions, partial outages, long context and rollback/recovery.
- Calculate outcome-level unit economics. Count all attempted tasks and failed calls in the spending numerator; only business-accepted outcomes go in the success denominator.
- Quantify uncertainty. Publish sample sizes, per-category acceptance, repeated-run variance and suitable confidence intervals; treat one successful demonstration as anecdote.
- Roll out gradually. Begin with read-only or approval-gated tasks, monitor drift, establish ownership and define automatic stop conditions.
- Audit quarterly or after material changes. Model, prompt, connector, workflow or pricing changes can invalidate earlier performance and cost comparisons.
Recommended enterprise evaluation scorecard
| Dimension | Metric to measure | Release rule |
|---|---|---|
| Quality | Accepted completion by task category; abstentions; factual error rate | Pre-agreed floor on independent holdout set |
| Execution | Tool choice, parameter validity, idempotency, unauthorized writes | Zero critical unauthorized actions in safety tests |
| Economics | Fully loaded cost per accepted outcome; realized capacity or cash savings | Risk-adjusted cost below approved business threshold |
| Latency | P50/P95 end-to-end duration including queues and approvals | Meet operational SLA with headroom |
| Governance | Logging, identity, retention, incident handling, data policy | Security/legal sign-off for the actual workflow |
| Drift | Performance after model, tool or policy updates | Automated regression gate and rollback plan |
Evaluation design here follows practices published by Anthropic and Microsoft. These references help structure tests but do not supply success rates for the three modeled workflows.
An enterprise procurement checklist that resists hidden agent costs.
Contract and cost observability
Request itemized API usage, pass-through charges, included tool calls, context tier policies, overages, currency conversion, contract minimums, cancellation terms and per-workflow attribution. Require audit-friendly export.
Data rights and privacy
Document input retention, training usage, regional processing, subcontractors, deletion SLAs, tenant isolation, audit access and recovery. Do not assume a generic privacy statement is adequate for regulated data.
Permissions and control
Specify least-privilege service identities, approval gates on irreversible actions, constrained tools, rate limits, output validation and emergency revocation. Align controls with NIST AI RMF and the OWASP Agentic Top 10 where relevant.
Independent evaluation rights
Require version pinning where available, a representative holdout evaluation, ability to instrument tool calls, clear acceptance criteria and rules for what constitutes a paid completed task.
Service level, reversibility and liability
Clarify support escalation, on-call ownership, failed-operation retries, rollbacks, evidence retention, incident notices and liability for incorrect actions. Test import/export before purchasing.
Exit economics
Price migration, prompt/tool adaptation, data portability and parallel operation. Exit cost is not always a monthly line item, but it belongs in the investment committee memo.
AI agent pricing questions enterprise teams actually ask.
How much does an AI agent cost per month in 2026?
There is no universal price. In our illustrative three-workflow model, total recurring monthly spend ranges from $8,701 to $15,053, but these are constructed scenarios—not market-wide pricing ranges. The model API component alone ranges from about $17 to $280. Your real cost depends on volume, accepted outcomes, human review, platform terms and governance.
What does it cost to build an AI agent?
Budget setup engineering, system integrations, workflow permissions, observability, evaluation datasets, security design and change management. Our scenarios assume one-time implementation of $18,000, $42,000 and $60,000 respectively; these figures are editable assumptions rather than quotes or typical market prices.
How do you calculate cost per successful AI agent task?
Divide the fully loaded cost of all attempts by the number of outcomes accepted against pre-defined criteria. Include retries, failed calls and human checks in the numerator. Specify whether one-time implementation is allocated across the year, as we do here.
Does a cheaper model lower the total cost of ownership?
Not necessarily. Cheaper tokens may increase prompts, retries, human corrections or downstream errors. Compare candidates on the same task set, quality threshold, SLA and approval process—not their input-token sticker price.
What is a good AI agent success rate?
There is no defensible universal benchmark. The acceptable rate depends on business value and consequences of error. A drafting assistant can permit correction; an agent authorized to move money should have much stricter controls and approval requirements. Measure per-task category and report uncertainty.
What is a good enterprise AI agent ROI?
The threshold belongs to the company's cost of capital, risk appetite and alternative investments. The example ROI figures here are outcomes of hypothetical inputs—not typical enterprise returns. Demand measured baselines and realized benefit evidence before placing them in a business forecast.
Build or buy: which approach is more economical?
Buying may compress time to market for standardized tasks; building may be necessary for unique processes and strict control boundaries. Compare all-in year-one spending, reliability obligations, future costs and exit provisions before deciding.
Can I reproduce the numbers in this article?
Yes. Download all scenario inputs in JSON, inspect the source-linked SXF model pricing records, use the equations in the methodology section, and adjust acceptance, human review and realizable value in the sensitivity panel. This reproduces the model arithmetic, not real deployment performance.
Primary sources and full disclosure.
SXF separates original provider price records from planning assumptions and external evaluation frameworks. We do not use an aggregator difference as proof that direct provider pricing is wrong. Review the cited source and its specific consumption tier when using any rate in a procurement calculation.
- SXF AI Model Pricing — Internal catalog of published Standard API model rates, including provider records and verification dates.
- OpenAI API pricing — Official API price schedules and service-tier conditions.
- Anthropic Claude pricing — Official token, cache-write and cached-token pricing conditions.
- Google Gemini API pricing — Official model and context-dependent pricing schedules.
- Anthropic — Demystifying evals for AI agents — Evaluation harnesses, graders, multi-step performance and regression measurement; published January 9, 2026.
- Microsoft Foundry — Agent evaluators — System completion, process quality, tool selection and tool parameter evaluation guidance; some features are preview.
- NIST AI Risk Management Framework — AI governance, measurement and risk-management practices; includes the NIST AI 600-1 generative AI profile.
- OWASP Top 10 for Agentic Applications 2026 — Agentic-system security threat categories and recommended mitigations.
Limitations and exclusions
The article uses no customer records, no randomized operational experiment, no surveys, no measured agent pass rates, no estimates of sample variance and no guarantee of savings. The three workloads were deliberately selected to illustrate varied outcomes; they are not a statistically representative sample. The study also omits financing costs, taxes, contractual pricing discounts, output quality penalties, rare incident losses, discounting, ramp-up curves and opportunity costs beyond explicit expense lines. Unpriced features and data rights must be separately budgeted.
Content review policy: the scenario study is updated if its assumptions or methods change, while source-linked token rates are tracked separately in the AI Agent Cost Index. Past results should always be interpreted with their as-of date. A new model price record does not retroactively prove that a previous scenario was accurate.
Revision record: October 10, 2026 — repositioned the prior pricing explainer as an enterprise economic study with reproducible cases, reliability-sensitive calculations, business evaluation criteria, purchasing framework and explicit evidence classification. Original URL retained; canonical remains self-referential.
Your workflow will differ. Test it before you buy.
Use SXF's separate Agent Cost Index to choose the model, adjust your token workload, tool fees and approval burden, then document what must be verified in a limited production pilot. For research methodology or an editorially independent collaboration, contact SXF directly. Sponsorship never changes source selection, arithmetic or reported conclusions.